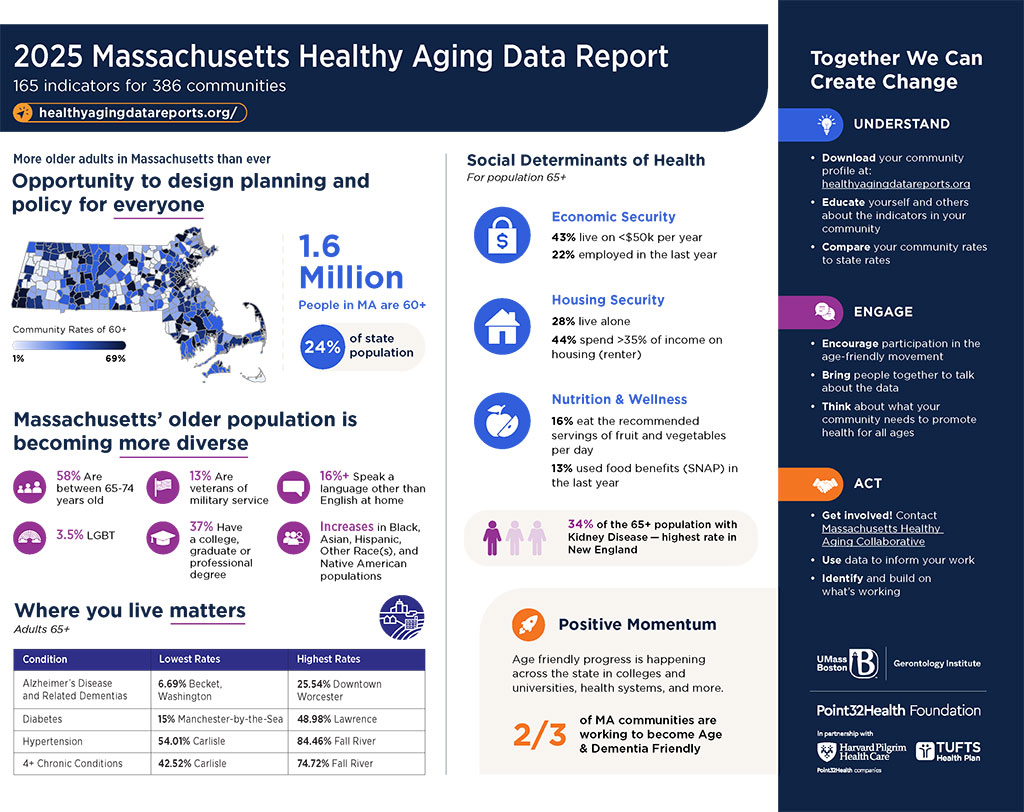
• About
  • Contact
  • Data Report
    • Explore the Report
    • Find Other Data
  • Programs
    • Overview
    • Find an Organization
    • Stories from the Field
  • Age-friendly
    • Age- and Dementia-Friendly Resources in MA
    • Age-friendly communities in MA
    • Age-friendly tool kit
  • Resources
    • Resource Library
    • Submit a Resource
  • Join
    • Become a Member
    • Members
  • News

Data Report

  • Explore the Report
    • Highlights Report
    • Community Profiles
    • Infographic
    • State Maps
    • Interactive Map
    • Data Sources and Methods
  • Find Other Data
    • Area Plans on Aging
Home › Data Report › Explore the Report › Infographic
+/-Text SizeMac users: Increase text size by holding command and +. Decrease text size by holding command and -.

PC users: Increase text size by holding CTRL and +. Decrease text size by holding CTRL and -.
       Print                

Infographic

This infographic provides a snapshot of findings from the 2018 Massachusetts Healthy Aging Data Report.

Download the infographic (PDF)

  • About
  • Contact Us
  • Site Map
  • Privacy Policy
  • Terms & Conditions